How to create transient reservations forecast that is based on short-term trends?
How can we forecast number of reservations transient guests will book for a specific day in the future if we can not rely 100% on the last year's data? There is a forecasting method that gives more weight to the current short-term trends.
How can we forecast number of reservations transient guests will book for a specific day in the future?
The simple answer is to look at the last year's data and reservations on hand (ROH) this year, assuming the future will follow the past.
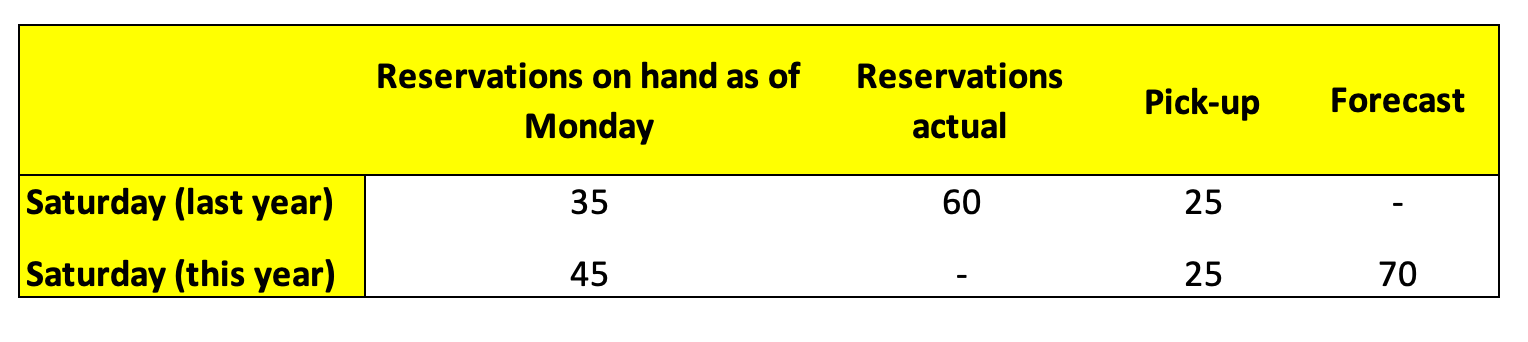
For example, today is Monday, and we would like to forecast a number of reservations for the coming Saturday.
First, we look at how many reservations for Saturday we had on the same Monday one year ago (35) and the final number of reservations on Saturday one year ago (60).We calculate last year's pick up (60 - 35 = 25). Then, we look at reservations on hand (ROH) that we have on Monday this year (45) and add last year's pickup to receive a forecast for Saturday (45 + 25 = 70). This method assumes that the previous years' pace will remain unchanged this year.
What if we can not rely 100% on the last year's data?
For example, the COVID-19 pandemic made reservations data from 2019 obsolete. Hotels can not expect the same level of demand and the same booking patterns. Revenue managers should give more weight to the current trends in this case.
There is a forecasting method that could help produce more accurate forecasts that are based on the most recent trends.
Step 1 - Booking Curve.
The booking curve shows the number of reservations on hand (ROH) at a different time before the arrival date. Transient segments (retail, discount, wholesale, etc.) will have different booking lead times, and its recommended to build segment-specific booking curves for the best forecasting results. Booking curves should also be specific to the day of the week.
We will build booking curves for the last six Mondays for the retail segment in our example.